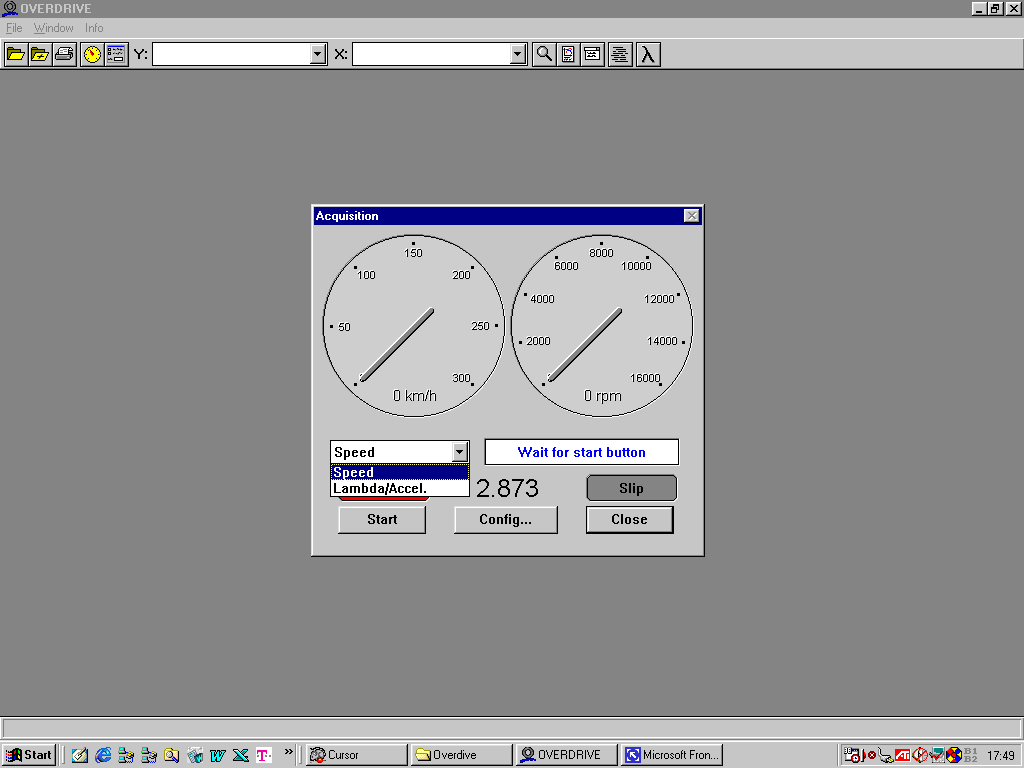
The operating is based on MICROSOFT WINDOWS 3.1 or higher.
It takes only a few minutes to get familiar with the system and you can carry out exact measurements.

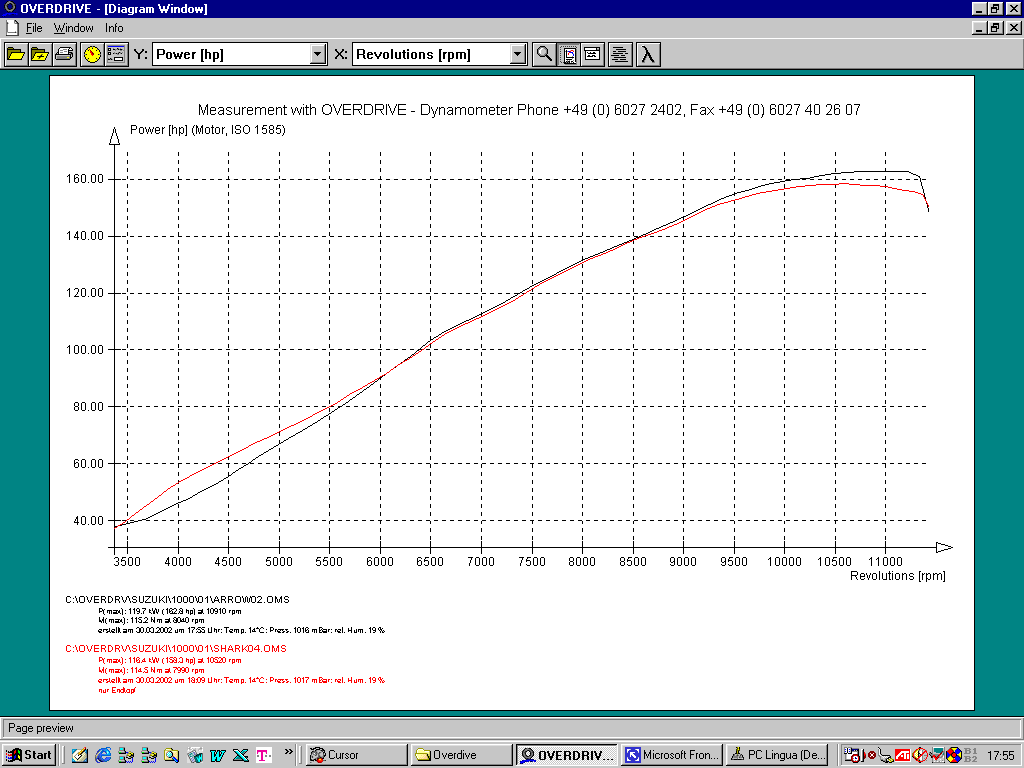
Sample print out
You can use either horizontal or vertical format.
Headline can be modified to your choice.
Data of max.power and torque will be printed out automatically
Additionally you can put in comments.
This sample shows the comparison of two exhaust systems for GSXR 1000 Suzuki.
System A indicates more peak power, system B is more smooth at low rpm.

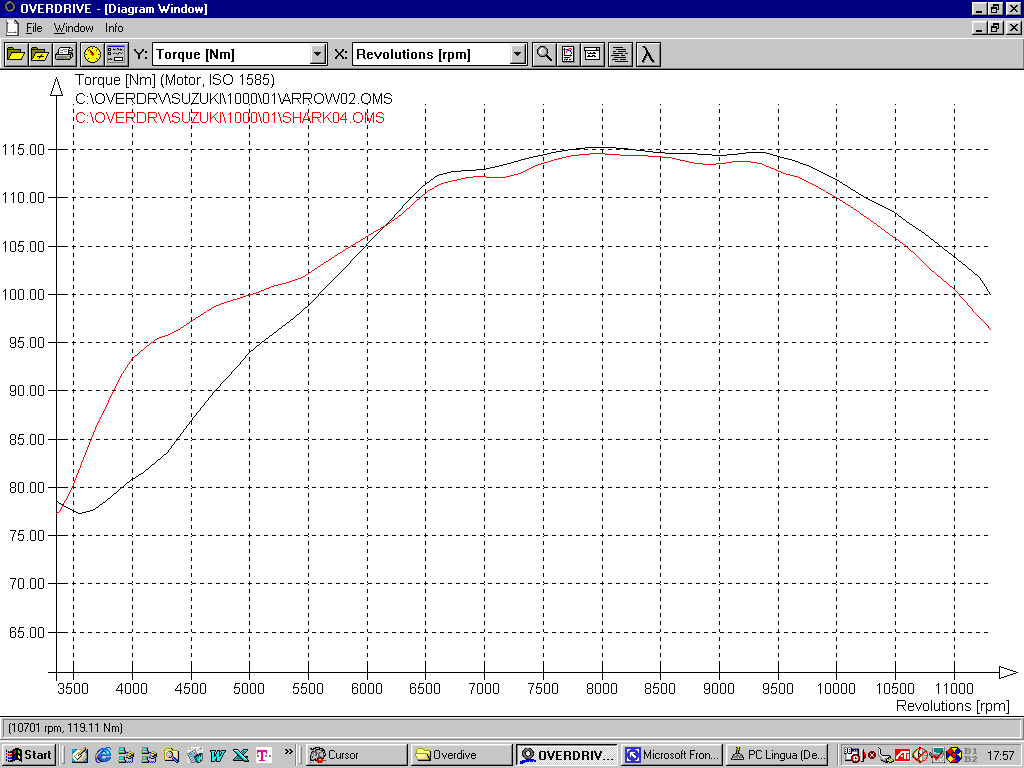
Screen samples on the PC monitor.
Comparison of torque curves shows the difference. System B indicates much better torque from 4000rpm to 6000rpm.
For race track system A might have some advantage.
For public road usage system B is more recommendable..

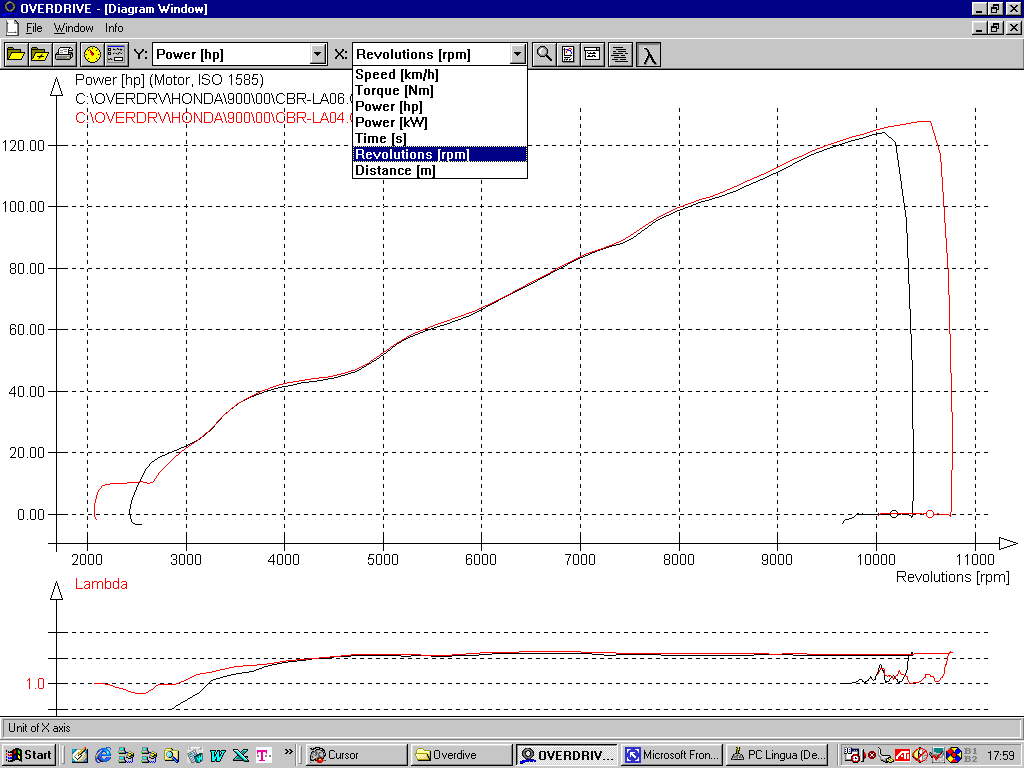
By checking lambda figures you have one more tool for tuning.
Black graph shows lean mixture. Peak power is slightly reduced.
